"The canonical example is to imagine that a precocious newborn observes his first sunset, and wonders whether the sun will rise again or not. He assigns equal prior probabilities to both possible outcomes, and represents this by placing one white and one black marble into a bag. The following day, when the sun rises, the child places another white marble in the bag. The probability that a marble plucked randomly from the bag will be white (ie, the child’s degree of belief in future sunrises) has thus gone from a half to two-thirds. After sunrise the next day, the child adds another white marble, and the probability (and thus the degree of belief) goes from two-thirds to three-quarters. And so on. Gradually, the initial belief that the sun is just as likely as not to rise each morning is modified to become a near-certainty that the sun will always rise."This example made me wonder about two things:
1) Although they call it a "canonical example", I had not heard it before, so I wondered where it came from, and
2) Although the example demonstrates the general idea of updating beliefs in light of new evidence, it is not obvious that the hypothetical newborn is actually doing a Bayesian update.
At the risk of spoiling the fun, here is what I found:
1) The example is from Richard Price's commentary on the original essay, discovered after Bayes's death, that presented what came to be called Bayes's Theorem. So I am embarrassed that I didn't know it.
2) The analysis is correct for a particular prior distribution and for a particular interpretation of the posterior, but presented in a way that obscures these details.
A false start
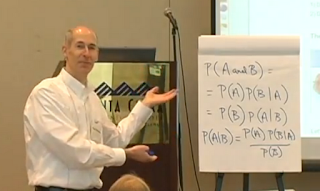
In fact, it is not easy to formulate this example in a Bayesian framework. One option (which fails) is to compute posterior probabilities for two hypotheses: either A (the sun will rise tomorrow) or B (the sun will not rise tomorrow).
We are given the priors: P(A) = P(B) = 1/2.
But when the sun rises in the morning, how do we compute the posteriors? We need the likelihoods; that is, the probability of the evidence (sunrise) under the two hypotheses. It is hard to make sense of these likelihoods, so we conclude that this formulation of the problem isn't working.
The beta distribution
A more fruitful (and more complicated) alternative is to imagine that the sun will rise with some probability, p, and try to estimate p.
If we know nothing about p, we could choose a prior distribution that is uniform between 0 and 1. This is a reasonable choice, but it is not the only choice. For example, we could instead make the odds (rather than the probabilities) uniform over a range of values, which has the intuitive appeal of giving more prior weight to values near 0 and 1.
But starting with uniform probabilities is equivalent to starting with a Beta distribution with parameters α = β = 1, which has a mean value of α / (α + β), or 1/2. And the Beta distribution has the nice property of being a conjugate prior, which means that after an update the posterior is also a Beta distribution.
We can show (but I won't) that observing a success has the effect of increasing α by 1, and observing a failure increases β by 1. And that's where the white and black marbles come in. The author of the example is using the marbles as a sneaky way to talk about a Beta distribution.
After one sunrise, the newborn's posterior belief about p is a Beta distribution with α=2, β=1, which looks like this:

Similarly, after two successful sunrises, the posterior looks like this:

In summary, this example demonstrates the general idea of a Bayesian update, but think the way the calculation is presented is misleading.
Price's version
As I said, the example is from Price's comments on Bayes's article. Here is Price's version, from the page numbered 409 [in the original typeface, the letter "s" looks like "f", but I will fpare you]:
"One example here it will not be amiss to give.
"Let us image to ourselves the case of a person just brought forth into this world and left to collect from his observation of the order and course of events what powers and causes take place in it. The Sun would, probably, be the first object that would engage his attention; but after losing it the first night, he would be entirely ignorant whether he should ever see it again. He would therefore be in the condition of a person making a first experiment about an event entirely unknown to him. But let him see a second appearance or one return of the Sun, and an expectation would be raised in him of a second return, and he might know that there was an odds of 3 to 1 for some probability of this. This odds would increase, as before represented, with the number of returns to which he was witness. But no finite number of returns would be sufficient to produce absolute or physical certainty. For let it be supposed that he has seen it return at regular and stated intervals a million of times. The conclusions this would warrant would be such as follow --- There would be the odds of the millioneth power of 2, to one, that it was likely that it would return again at the end of the usual interval."To interpret "an odds of 3 to 1 for some probability of this" we have to look back to page 405, which computes the odds "for somewhat more than an even chance that it would happen on a second trial;" that is, the odds that p > 0.5. In the example, the odds are 3:1, which corresponds to a probability of 0.75.
If we use the Beta distribution to compute the same probability, the result is also 0.75. So Price's calculations are consistent with mine; he just uses a different way of summarizing them.